Welcome to XPER documentation 📚!
This website contains the documentation for installing and contributing to XPER, details on the API, and a comprehensive list of the references of the datasets, models and metrics implemented.
Resources
Free software: MIT license
GitHub: https://github.com/hi-paris/XPER
Installation
pip install XPER
Example of use of the library
import XPER
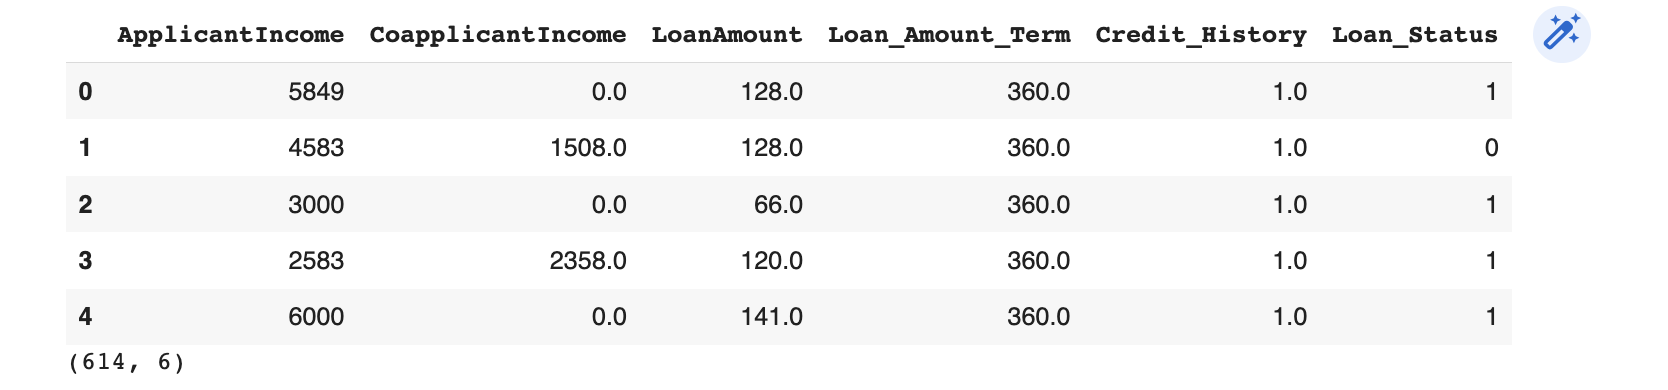
1️⃣ Load the Data 💽
from XPER.datasets.load_data import loan_status
import pandas as pd
from sklearn.model_selection import train_test_split

loan = loan_status().iloc[:, :6]

X = loan.drop(columns='Loan_Status')
Y = pd.Series(loan['Loan_Status'])

X_train, X_test, y_train, y_test = train_test_split(X, Y, test_size=0.15, random_state=3)
2️⃣ Load the trained model or train your model ⚙️
from xgboost import XGBClassifier
import xgboost as xgb

# Create an XGBoost classifier object
gridXGBOOST = xgb.XGBClassifier(eval_metric="error")

# Train the XGBoost classifier on the training data
model = gridXGBOOST.fit(X_train, y_train)
3️⃣ Monitor Performance 📈
from XPER.compute.Performance import ModelPerformance

# Define the evaluation metric(s) to be used
XPER_ = ModelPerformance(X_train.values, y_train.values, X_test.values, y_test.values, model)

# Evaluate the model performance using the specified metric(s)
PM = XPER_.evaluate(["AUC"])

# Print the performance metrics
print("Performance Metrics: ", round(PM, 3))

For use cases above 10 feature variables it is advised to use the default option kernel=True for computation efficiency ➡️
# Option 1 - Kernel True
# Calculate XPER values for the model's performance
XPER_values = XPER_.calculate_XPER_values(["AUC"])

# Option 2 - Kernel False
# Calculate XPER values for the model's performance
XPER_values = XPER_.calculate_XPER_values(["AUC"], kernel=False)

4️⃣ Visualisation 📊
import pandas as pd
from XPER.viz.Visualisation import visualizationClass as viz

labels = list(loan.drop(columns='Loan_Status').columns)
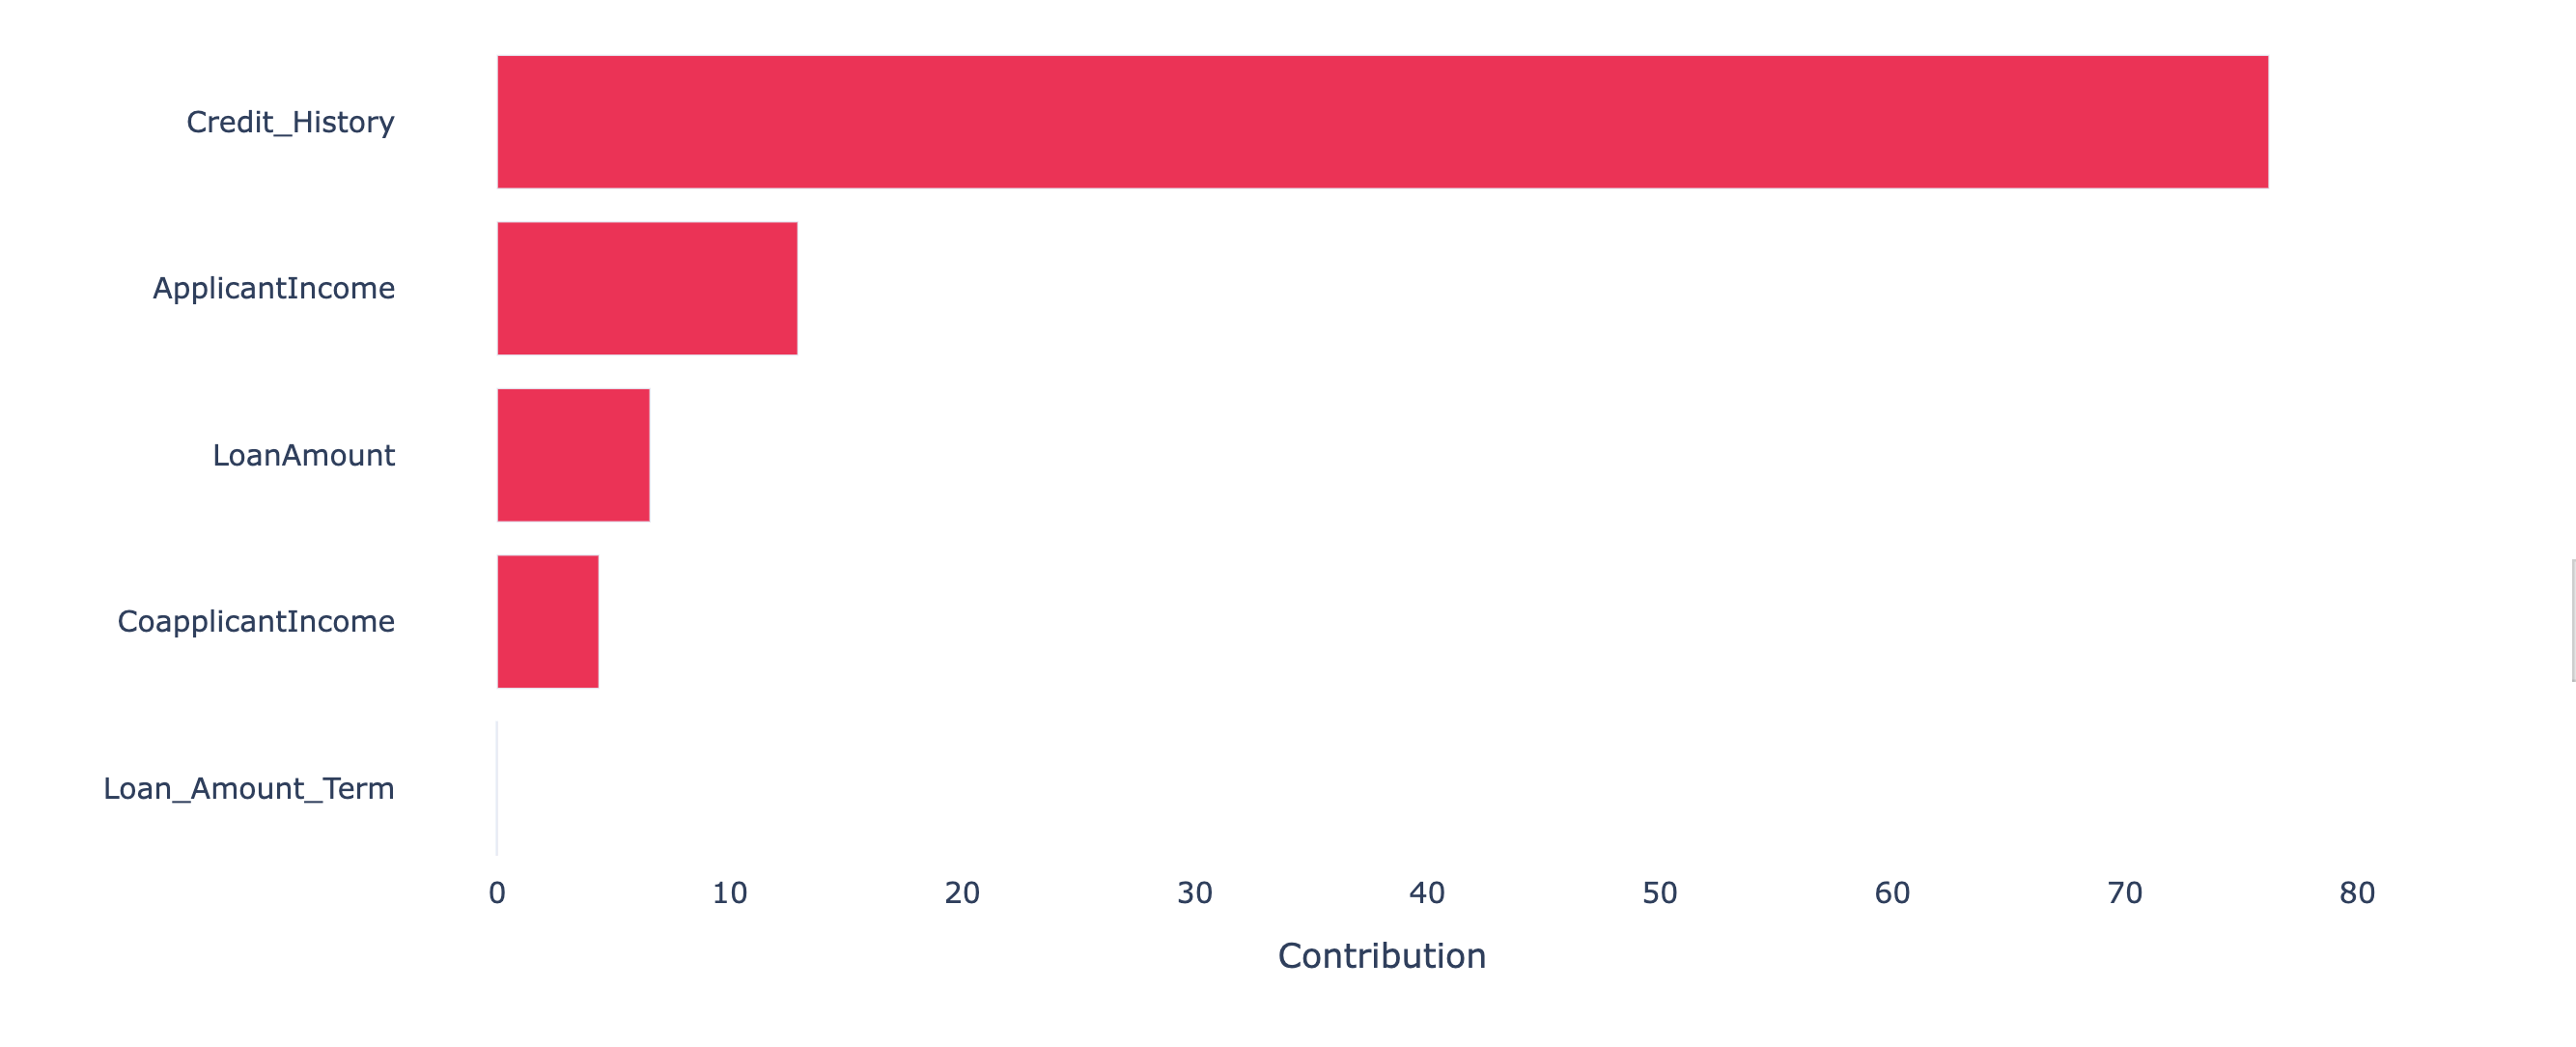
Bar plot
viz.bar_plot(XPER_values=XPER_values, X_test=pd.DataFrame(X_test), labels=labels, p=6, percentage=True)
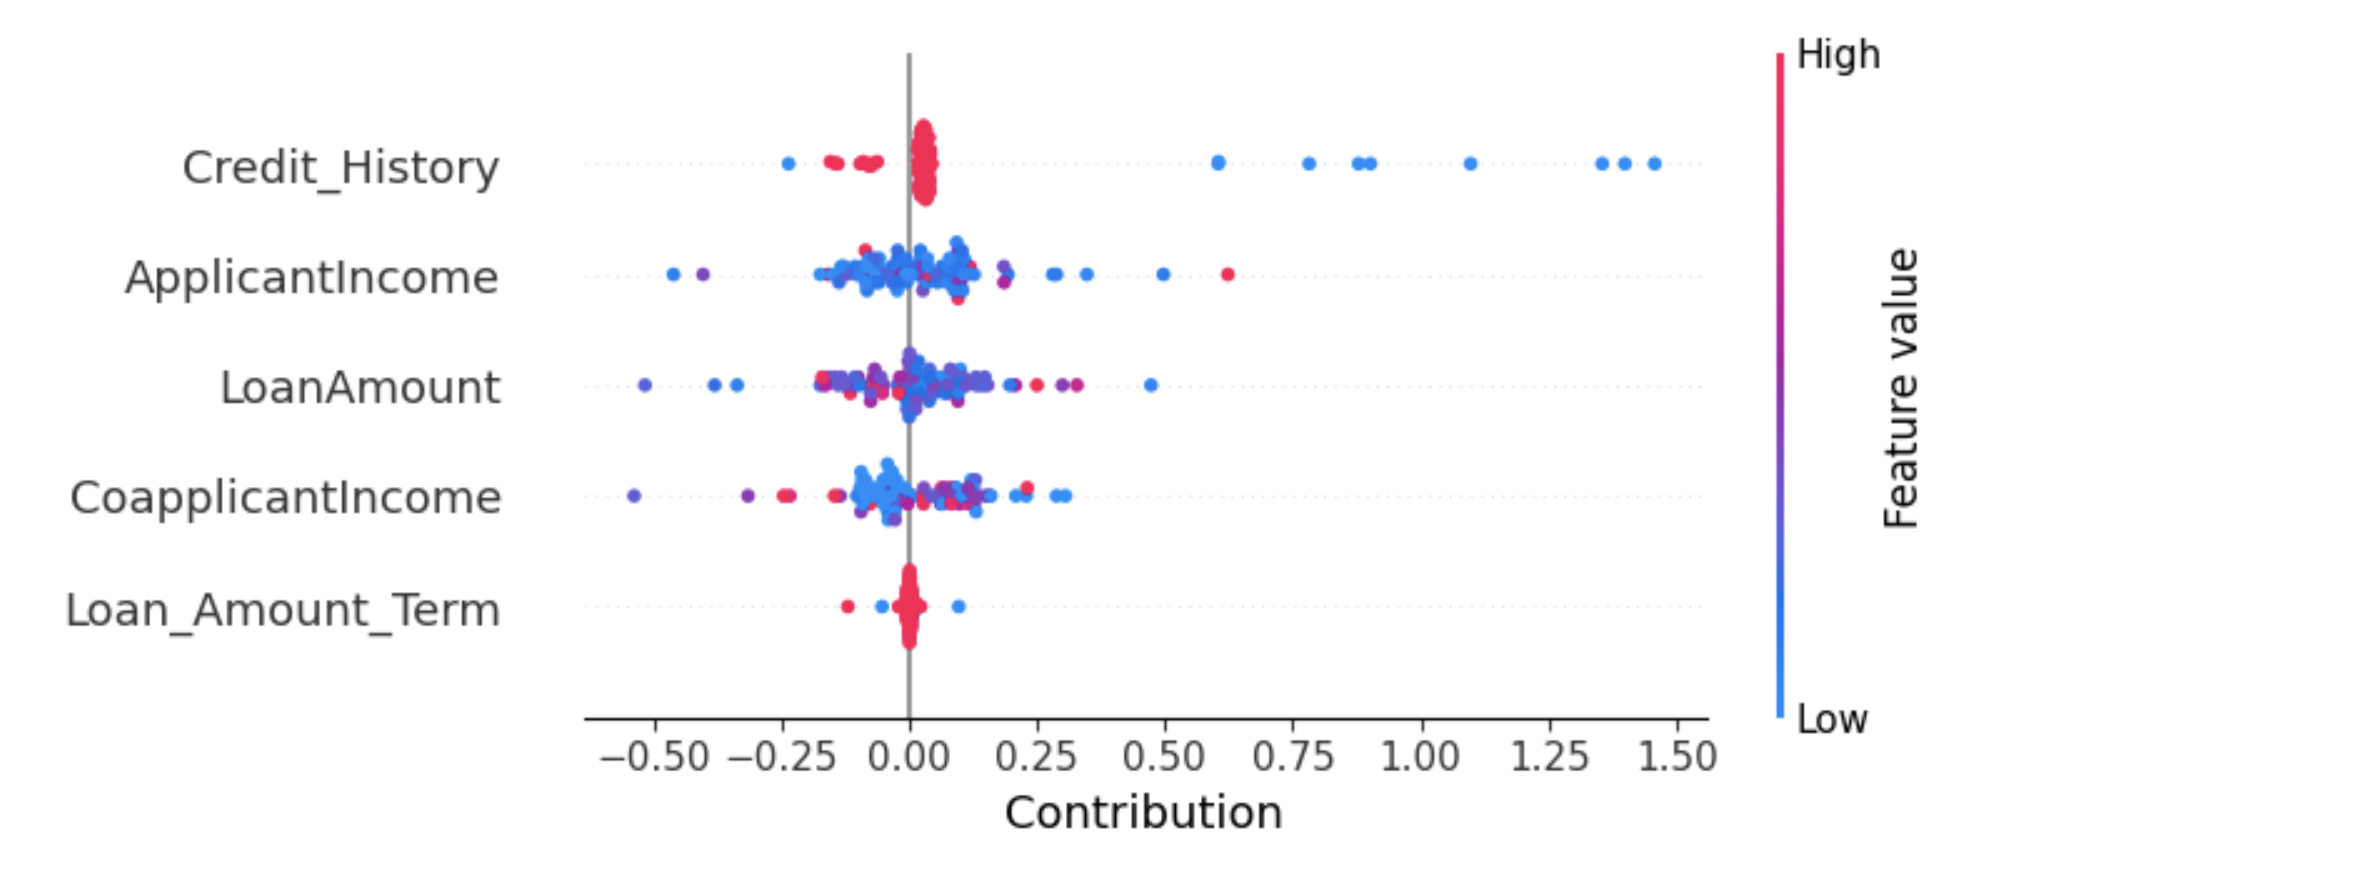
Beeswarn plot
viz.beeswarn_plot(XPER_values=XPER_values, X_test=pd.DataFrame(X_test), labels=labels)
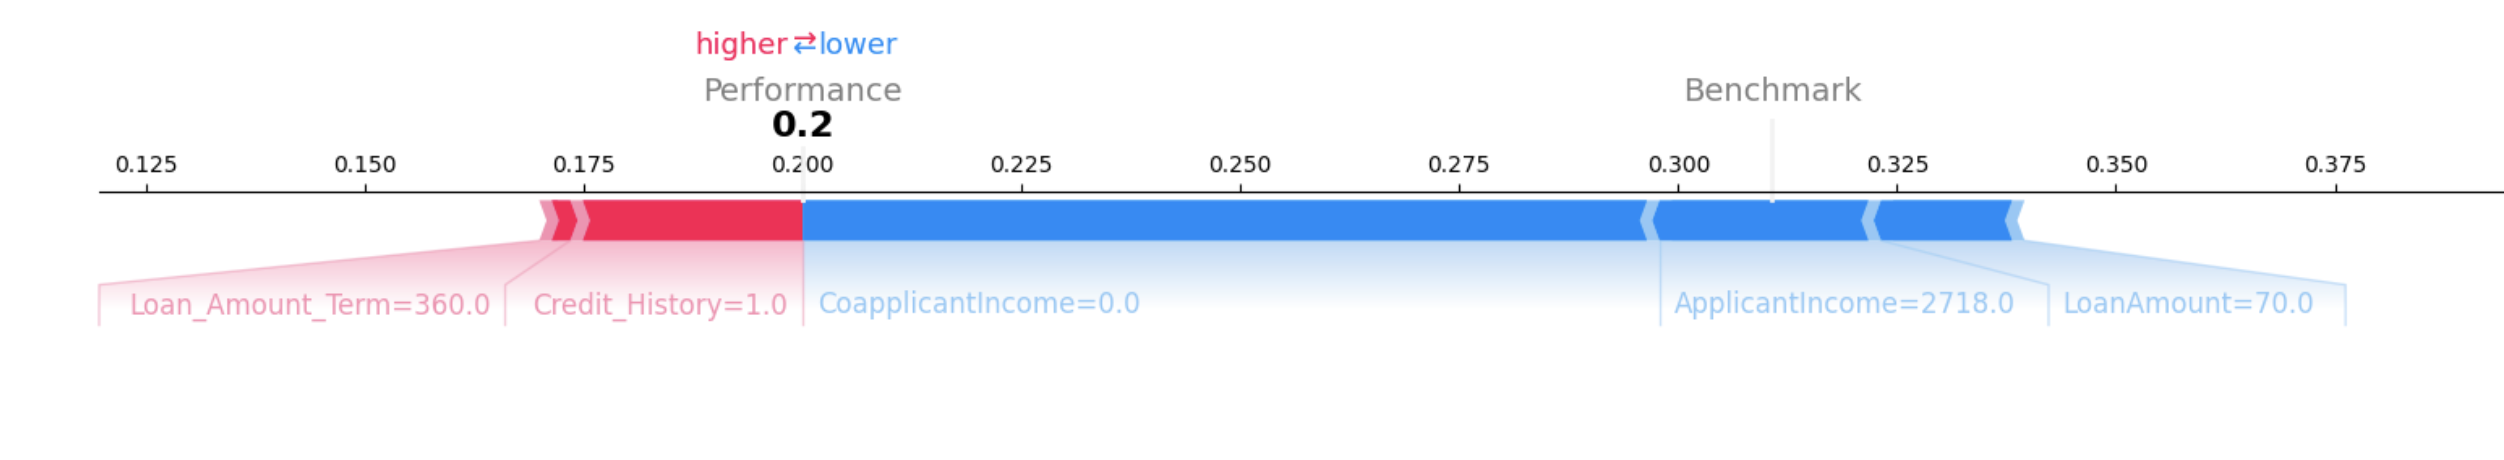
Force plot
viz.force_plot(XPER_values=XPER_values, instance=1, X_test=X_test, variable_name=labels, figsize=(16,4))
Reference
Hué, Sullivan, Hurlin, Christophe, Pérignon, Christophe and Saurin, Sébastien. “Measuring the Driving Forces of Predictive Performance: Application to Credit Scoring”. HEC Paris Research Paper No. FIN-2022-1463, Available at https://ssrn.com/abstract=4280563 or https://arxiv.org/abs/2212.05866, 2023.